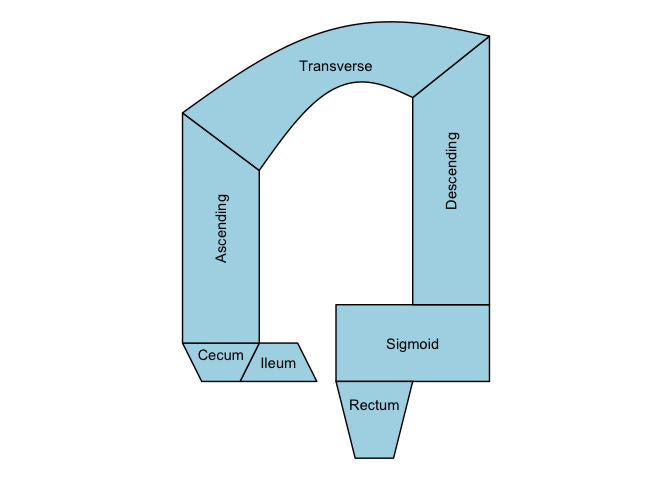
The goal of ggcolonviz is to provide a ggplot2 extension for visualizing the colon in a clear and informative way. It offers a set of functions to create detailed and customizable plots of the colon, allowing users to easily represent various aspects of colon anatomy and related data.
Example
Here is a basic example of how to use ggcolonviz to create a simple plot of the colon:
library(ggcolonviz)
library(ggplot2)

patient_data <- data.frame(
  x = 0,
  y = 0,
  part = c(
    "Ileum",
    "Cecum",
    "Sigmoid",
    "Ascending",
    "Descending",
    "Transverse",
    "Rectum"
  )
)

patient_data |>
  ggplot(aes(x = x, y = y, part = part)) +
  geom_colon(
    color = "black",
    linewidth = 0.5,
    fill = "lightblue"
  ) +
  geom_colon_label() +
  coord_fixed() +
  theme_void()